Friday, December 25, 2009

The Origins of the Bell Curve -- The Real Secret of the Super Rich Part 2

This is Part 2 of The Real Secret of the Super Rich. In Part 1 I demonstrated how the super rich are outside any (Gaussian) bell curve fit of the measured wealth distribution of the rest of us. At the end I gave a one word hint -- nonlinearity -- as to the real secret, how the super wealthy dwell outside the bell curve, as if they were a different sort of being than the rest of us. Finally, after much delay, I shall add flesh that that explanation, by explaining the linear case, where the bell curve comes from and why statisticians expect to find them for diverse phenomena. Then, we'll have a look at where the assumptions underlying the bell curve break down when it comes to income and wealth.

Bell curves arise when we add up multiple independent random variables. Instead of working through a hairy mathematical proof, let's do some simple experiments to demonstrate the idea. Consider the following simple game: Flip four quarters at the same time; add up the value of all those which come up heads; that's your score. Multiply by $100,000 and that's your annual family income. Think of this as a very primitive competitor to Milton Bradley's Life game.

Now consider many people playing this game. If we record their scores we get a wealth distribution. You can generate such a wealth distribution at home. Just get a sheet of 1/4 inch graph paper and write the possible values ($.0, $.25, $.50, $.75, $1.00) in a row. Then flip the quarters again and again. After each flip fill in a square above the number corresponding to the score. With around 100 flips you should see something like this:

Probability distribution for four quarters

By the way, I cheated. I didn't actually flip physical coins. I wrote a C# program to flip virtual coins using a random number generator and then plot the results. I had a good reason: the next experiments are more complicated and involve more flips. A physical flipping session would take too much time. (As it was, writing the C# code took some time, since I am a C++ programmer by day. I used this exercise as an excuse to play with C#, and that's one reason why it took me so long to get this post up.)

Your results -- if you did your homework -- should similar but not identical to mine. I can say this with confidence even though I don't have your quarters. Yes, you could have a distribution where most of the flips are $.00 or $1.00, but this is very unlikely. There is only one way to score $.00: TTTT. There is only one way to score $1.00: HHHH. Meanwhile, there are four ways to score $.25: HTTT, THTT, TTHT, and TTTH. Similarly, there are four ways to score $.75: THHH, HTHH, HHTH, and HHHT. Finally, there are six ways to score $.50: HHTT, HTHT, HTTH, THHT, THTH, and TTHH.

This is a general principle. With multiple independent random variables you get more possible flips/rolls. And as we increase the number of independent random variables, we get a smoother bell shaped curve. For example, let's replace the four quarters with 10 dimes:
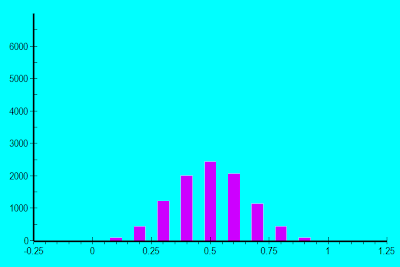


10 Dime Distribution

Or replace the four quarters with 20 nickels:


20 Nickel Distribution

Note that I went up to 1000 rolls in order to get a good statistical sampling. With the computer doing the rolling for me, why not? Diligent readers can perform these experiments with graph paper and watch the distribution evolve.

No rule says that all the random variables have to be the same size, nor do they all have to be binary. We could replace one quarter with 5 nickels, two quarters with 5 dimes and one quarter (approximately) with two 12 sided dice. The result:


5 Nickels 5 Dimes and 2 Twelve Sided Dice Distribution

Note how the hump narrows as we use smaller coin denominations. To map these experiments with the national income distribution, we'll need to scale by standard deviation and shift to match median values. Our four quarter experiment so rescaled gives us:

4 quarter probability distribution scaled to US income distribution


Our 20 nickel experiment gives us:


20 Nickels Scaled to National Income Distribution

By now many of you are thinking, "So what? What do all these coin flips and dice rolls have to do with the super rich?" The answer: let's consider each of the original quarters as a factor which leads to income. Let one quarter represent intelligence. Let another represent health. Let the third represent ambition and the fourth represent startup capital; that is, family wealth or connections which come from growing up in the right neighborhood. Our first experiment crudely models these four factors as "you either have it or you don't." The 20 nickel experiment can be thought of as replacing each quarter by 5 nickels, giving us a rough bell distribution for each factor. We could get smoother yet by replacing each quarter with 25 pennies, as below:


100 Pennies Scaled to National Income Distribution

But even this 100 penny experiment gives us a mere $425,000/year maximum income when scaled to the census figures -- and no one got that much even after 100,000 rolls! With 100,000 rolls the highest income was $215,000/year and I only rolled that once (which scales to 1160 people having that income). Where are the Bill Gateses and Sam Waltons? We could stretch our distribution further by using more coins/dice. Income is a function of more than four factors. For example Bill Gates is intelligent, from a well-off family, very interested in computers (vs. yoga, philosophy, or politics), very interested in business and making money (unlike his early competitors), had access to computer time back when it was very expensive (thus getting in on the ground floor of an industry), and perhaps a bit lucky. Yet even with more factors the factors still don't add up to give us Bill Gates income.

But should we be adding? Does computer skill = intelligence plus interest plus access to computers? Maybe we should be multiplying some of these factors! We'll look at some experiments with multiplied random variables in the next post, and then meditate on the consequences.

Friday, September 11, 2009

The Real Secret of the Super Rich (Part 1)

The super rich are different from the rest of us – way different. According to the numbers, they are of a different kind, a different species even. Back in the old days this was common “knowledge.” The upper classes declared themselves a different lot, and mere commoners bowed before them, addressing them as “lord” “lady” and similar distinguishing honorifics. In this more enlightened age, we know better. We have examples of men working their way from rags to riches, or (think Bill Gates) from upper middle class to owning more than many sovereign nations. Then again, maybe Bill Gates is a mutant; he rather looks like one…

Perhaps the super rich are not mutant superbeings. Maybe the super rich simply exploit a secret. At meetings of Skull and Bones, the Council on Foreign Relations, and the Bilderbergers, the Insiders chant special words of Power, invoking dark forces which allow them dominate mere mortals, and dwell on this earth in imperial luxury at the cost of their immortal souls – and their ability to correctly read CIA reports.

Maybe not. The real secret of the super rich is a bit more mundane, but it is important. While we cannot all fully use of this secret – someone needs to take out the garbage – we can all learn much from it. We can use it to better use our own abilities and become better off. This country can and should have a much larger upper class – more rich people, but a much smaller gap between rich and super rich. Some of you reading this blog may well join this broader upper class by applying the secret I am going to reveal.

While I started off silly, I was quite serious about the super rich being different. The super rich are not merely the upper end of the bell curve in money making ability. The numbers say otherwise.

Back in 1994 Charles Murray and Richard Herrnstein created a firestorm with their book The Bell Curve[1]. They had the temerity to suggest that intelligence accounts heavily for class differences, and that intelligence is hereditary to a significant degree. The politically correct were aghast; how dare anyone suggest that class differences were natural? How dare they suggest that genetics affects class!

The politically correct were wrong to vilify the authors, especially Charles Murray. Murray is no right wing extremist. He advocates for a rather large citizen’s dividend, an unconditional government check for all. (See In Our Hands: A Plan to Replace the Welfare State.[2]) Charles Murray is more progressive than the late Ted Kennedy. The idea of a bell curve is progressive. Wealth and income following a bell curve (a normal distribution) would be a socialist utopia compared to what we have today!

The super rich are outside the bell curve. That’s why my intro riffed on mutants and dark forces. To see this, let’s plot a crude bell curve to fit the rest of us. I don’t need to be precise to make my argument clear. To start with, let’s review what a bell curve is, and why statisticians look for it. I’m going to hand wave through a bit of math. For those not mathematically inclined, you can skip to the charts. For those who don’t like hand-waving, you can go to Wikipedia for more, or better yet, get a statistics book. (Maybe I’ll write a future post with an intuitive derivation.) The central limit theorem theorem states that when some variable (such as household income) is the sum of many independent random variables, said variable approximately follows a Gaussian distribution:


where

and


Now, all we need are a few data points to set the average and standard deviation, and we will have a probability distribution for any income range – assuming that income does follow a normal distribution. Wikipedia has a nice page on household income in the United States. I’m going to yank some numbers off this page and fit a curve. Once again, the numbers do not have to be exact to make my point. According to this page, median household income is about $50,000, with 116 million households in the U.S. Let’s use $50,000 for our average income. (This is incorrect in reality, but would be true if income followed a normal distribution.) Scrolling down, I see that the bottom quintile (the bottom 20%) makes less than $18,500.

Pulling out my handy dandy CRC Standard Mathematical Tables, I see that the integral of the tail end of the bell curve is .2 (i.e., 20%) when x is .84 standard deviations below the norm. So we can now solve for the standard deviation.


We can view this below graphically. The red area represents those in the bottom quintile.


Now let’s look at the quite well off, those making $150,000 or more. These families make $100,000 more than the median, or 2.66 standard deviations. I colored them blue in the graph below. According to the CRC tables, we should expect .36% of the population 418,000 families at this level or higher.

Now, let’s look at those making serious money, ONE MILLION DOLLARS per year. That’s 25.33 standard deviations from the norm. The CRC tables don’t go that high. Neither does Excel. Breaking out some more heavy duty math software[3], I come up with 7e-142! That 7 times 10 to the negative 142 power! Multiply that by a 116 million and you get 8.6 times 10 to the negative 134 families making a million dollars in one year. The probability of even a single million dollar a year income is infinitesimal! The probability of elves and fairies is higher. Hollywood is indeed a fairyland!

Let’s drop down to $250,000. According to the normal distribution, there should only be 5 to 6 families making more than $250,000 per year! Go up to $300,000 and the number drops to a fraction: .0015 families. Where did all the high-power lawyers go? What about the specialized doctors?

OK, so I may be off in some of these calculations. Perhaps the standard deviation should be higher. Let’s say I’m off by a factor of two. That means we still only have 5 families making over half a million dollars. We still have no 7 figure incomes. CEOs and celebrities are still as improbable as an invasion of the flying saucer men next Wednesday.

The super rich defy the bell curve. They are way outside the norm. The tabloid readers worship and socialists seethe with envy. I, a scientist and liberator, shall debunk both The Secret and socialism. The real secret of the super rich is…nonlinearity.

I will explain further in my next post. Stay tuned.


Notes
[1] Full disclosure: I have not read The Bell Curve. I have only read the backwash.

[2] I haven’t read this book either, but I did listen to a talk by Murray on this subject.

[3] MATLAB or any MATLAB clone (such as Octave) does the trick. Here is my code:


mu = 50000;
sigma = 37500;
income = 300000;
sdev = (income - mu) / sigma;
x = sdev / sqrt(2);
y = .5 * erfc(x);
nRich = 116000000 * y;

Thursday, August 27, 2009

The Super Rich Use “The Secret”…to Dupe the Masses

Attention all paranoids: you can put away your tin foil hats now. The Orbital Mind Control Radar has been out of commission for years (yet another legacy of the failed Bush Administration). Besides, the Insiders have found a much more powerful mind control tool: New Age gurus. Who needs public school, the FBI, the CIA, or the Orbital Mind Control Radar when New Age gurus can dupe the disgruntled into believing they are already rich and blaming their problems on their own stray thoughts. The elite can rest easy while the hapless masses waste their time – and their sanity – applying The Secret.

I have been wading my way through The Secret video for the last few nights, and I must give the creators credit: they do know how to stretch out a few simple ideas into an interminably long movie. But at least those ideas are wrong – for the most part.

The Secret begins with the same sort of conspiratorial silliness that I began with in the first paragraph, except they are serious. In their version the rich elite have been hiding The Secret from the masses throughout history – apparently solipsism, superstition, and wishful thinking were the tools of the rich and powerful throughout the centuries while the rest of humanity were duped into believing in physical reality. This is why the masses slave away learning science, engineering, economics, accounting, and other worthless disciplines while the Insiders happily visualize positive outcomes, follow hunches, and buy winning lottery tickets. That’s why you can find the world’s most rich and powerful people hanging out at the convenience store on Friday afternoons chatting about their fabulous weekend plans while playing Scratch and Win.

Or maybe not.

The writers of The Secret even had the gall to invoke the authority of history’s most enlightened thinkers – the very people who got us out of superstitious “New Age” thinking and into the very successful empirical mindset which dominates the West today. The Secret pulls their quotations out of context, most dishonestly. For example, Einstein was big on imagination, but Einstein was not wasting his time imagining what it would be like to be a great physicist! Einstein was imagining possible mechanisms to explain real physical phenomena. (Speaking of physics, I have forgotten way more quantum mechanics that all the so-called “quantum physicists” interviewed in the movie combined.)

This is not to say that The Secret contains nothing but falsehood. That wouldn’t fly. As C.S. Lewis noted decades ago, effective evil is goodness bent, not goodness broken. Lenin and Stalin were incredibly deadly because they mixed some good intentions toward the working class with their envy, hatred and bad economic theories. Adolph Hitler was dangerous because he mixed a good intention – the defeat of communism – with his anti-Semitism and fascism.

Visualization works as a way to motivate yourself, not to modify the universe. If you spend more time visualizing your goals instead of complaining about your problems, you are more likely to do something useful to make good things happen – at least, as long as you don’t expect your goals to simply manifest themselves while you kick back in your Lazy Boy.

“Manifestation” also appears to happen if you practice visualization. Scientific fact: the brain filters out most of what the senses receive well before the signals reach your conscious mind. This is why camouflage works. This is why many optical illusions work. You may have received several of these illusions as an email from a friend; they go around like chain letters. Visualization can help program your subconscious filters to bring different objective facts to your attention. “Manifestation” happens because your mind is not infinitely powerful. It has limited storage and processing power; it cannot handle all the data from your five senses, much less rearrange reality to your liking.

Speaking of low-level thought processes, positive statements of goals do work better than negative statements for programming reflexes and habits. “Remember your car keys” works better than “Don’t forget your car keys” if you want avoid getting locked out of your car. “Eat more raw veggies and dry tuna” works better than “Don’t eat donuts” if you are trying to lose weight. Statements in the negative require more processing. Negative thinking is great for contemplation, strategic planning and creative thought. It just works poorly for fast reactions. This is why nerds rarely make the varsity basketball squad.

Positive thinking, as in believing you will succeed, also has its uses. (Believing you already have when you don’t is pure silliness, however.) If you believe you will fail, you will not try, or you will put in a mediocre effort while focusing most of your energies on your fallback position. If you truly believe you will succeed, you can ditch your fallback position and other expensive insurance. This increases your chance of success. But it also increases the price of failure! Worse yet, if you are too positive, you can underestimate the work required. Excess positive thinking demotivates! I’ve seen it happen hundreds of times. (Just go to a typical college campus and note the parties. Things quiet down right before exams.)

Study the truly successful. Bill Gates is a multi-billionaire in large part because of his pessimism. He worried about potential competitors and took action early and aggressively. Andrew Grove, former CEO of a little company called Intel, has a book out titled Only the Paranoid Survive. Warren Buffet, a rather successful investor, buys companies on the assumption that the financial markets could collapse at any time, that he may find no buyer for years.

So, if you want to make more money, learn to make money. Get an MBA or at least read The Portable MBA. Master a useful skill and how to market it. Read a make money website  which has actionable information instead of feel-good fluff.

But if you want to understand the super rich, those whose wealth defies the bell curve and boggles the imagination, come back here in a bit. I’m working on a series of posts that will expose the real secret of the super rich. Be forewarned: this series won’t be feel-good fluff; it will have graphs and even mathematics. If you want to grow rich, you might need to actually think.

Monday, May 18, 2009

Obama Unveils Massive New Subsidies for the Rich


On Thursday, May 7, President Obama unveiled his budget proposals for the rest of FY 2009 and for FY 2010. He described his priorities as: better health coverage for healthy young adults, more high voltage power lines to decorate the American landscape, record amounts of pork without using earmarks, and massive new subsidies for America’s super rich.


When questioned by an astounded press corps, Obama improvised, “After eight years of horrible ineptitude by the Bush Administration, I wondered why we still have so many Republicans remaining in the Senate. Why didn’t Al Franken win in a landslide? How could a Republican even come close – in Minnesota??


“Then I raised up my eyes and gazed heroically across our once-misgoverned land, searching for those who did not yet accept my message of ‘Change.’ And I beheld Billionaires for Bush marching the streets. My advisors told me it was impossible for us to convert America’s billionaires to the Democratic Party. I rebuked them, shouting, ‘YES, WE CAN!’


“No, it won’t be easy. Billionaires are different from the rest of us. Mere hundred million dollar pork barrel project barely register on their consciousness. That is why I am calling for 1.8 trillion dollars of direct subsidies for the rich in fiscal year 2009 and 1.2 trillion for fiscal year 2010.”


Later, Secretary of Health and Human Services, Kathleen Sebelius, took the podium and explained further, “America’s rich lost the most in the Bush financial crisis; they had the most to lose, after all. And our old money rich have been traumatized most of all: they lack the skills and drive necessary to recover on their own; there lives are purely driven by circumstances, ranging from their large inheritances to the recent financial catastrophe. To expect them to risk what they have left in a volatile financial market would be needlessly cruel.”


Secretary of the Treasury, Timothy Geithner, explained the details of the plan, “America’s old money rich need to be sheltered from today’s harsh realities as rapidly as possible. That is why we have set up the Rich Idiot Proof Online Financial Fund. We have made it easier than ever for trust fund babies to move their wealth out of stocks, corporate bonds and other risky assets and into 100% safe U.S. government debt. And with today’s record high deficits, there’s plenty to go around.”


Fictional Dialog, Real Subsidies


OK, the above press conference is fictional, but the economic implications are real. Deficit spending is regressive. High deficits provide brain-dead guaranteed income for the super rich – especially valuable to the unproductive super-rich. High deficits mean lower wages and higher trade deficits as well. (More details in future posts.)


I’m picking on Obama because he’s the one in power now. That, and it made more sense for Bush to run high deficits; after all, high deficits are a subsidy to the country club wing of the Republican Party. With record high deficits the current administration is betraying its working class base.


So, my sincere message to any liberals left in the audience: please tell your leader to stop subsidizing the unproductive rich and soaking the working class. Tell him you want the truly progressive balanced budgets of the Clinton years.